Multi Protocol Analyzer
LE-8200
- Battery Powered Handheld Troubleshooter for Field Testing
- 5.7-inch TFT color display
- Supports TTL, I2C, SPI, IrDA,
CAN, LIN, FlexRay, LAN and USB - Giga Byte Long Hour Record
- Mega Speed Mesurement
- Supports Logic Analyzer Analysis and Analog Waveform Analysis
| LE-8200 | : | Japanese model ( contains Japanese manual ) |
| LE-8200-E | : | World wide model ( contains English manual ) |
It is ideal for development tests of communications systems and industrial equipment, as well as for after-sale services and communication trouble analysis.
LE-series have been used in the industries of railways, aviation, and a variety of manufactures for few decades where reliability is very important. With optional kits, it can be used for developing network, in-vehicle, PC peripheral, embedded devices. Unlike the software based analyzers, it cannot be affected by the capability of PC and can be used in the place where PC is not allowed.
Supports TTL, I2C, SPI, IrDA, CAN ,LIN, FlexRay, LAN and USB
It works as a serial port monitor for RS-232C/422/485 with its standard measurement board.
By exchanging the measurement board, it also supports various types of protocols such as UART (of 1.8V/2.5V/3.3V/5V power supplies TTL level), I2C, SPI, CAN (widely used for automotive vehicle-bus), LIN, FlexRay, LAN (Ethernet, which is recently used for Internet of Things (IoT)), USB2.0 (now used for standard port of smart phones).
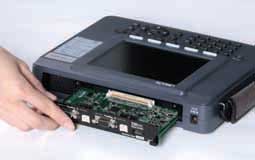
Simply pull out the interface board from the measurement unit and replace it with an expansion board for another protocol. |
OP-SB89G | OP-SB84 | |
 LAN LAN(PoE) |
 USB USB |
||
| OP-SB85L | OP-SB87 | ||
 TTL TTLI2C |
 CAN CANLIN |
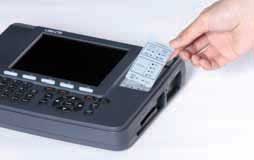
5.7-inch Large-sized Color TFT LCD
The large-sized LCD is an easy-to-understand color display showing a flow of communications protocol and data transmitted or received, thus greatly improving the efficiency of measurement data analysis.
Furthermore, the display of an English or Japanese guide accurately supports high-level measurement over communications.
The monitor function exactly records and visualizes communications data
The line monitor function, like a sniffer, allows the recording of telegrams and provides an easy-to-understand large-sized display without affecting the communications lines.
This function makes it possible to grasp the conditions of transmission and reception, thus greatly shortening the required time of troubleshooting.
As a standard feature, the LE-8200 supports a variety of communications standards, such as binary synchronous communications (BSC) for character-synchronous transmission, and high-level data link control (HDLC) for bit-synchronous transmission as well as asynchronous communications that are widely used for PC peripheral and microcontroller applications.
By adding an optional expansion kit, the LE-8200 will support many more communications standards.
 |
Provide some short demonstrations of analyzer uses. |
<Example of connection for online monitoring> |
 |
<Example of ASYNC communications>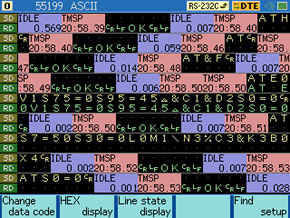 |
<Example of display in each frame>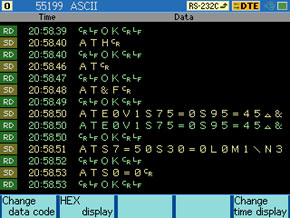 |
<Example of display with line state> |
<Example of PPP translation> |
<Example of HDLC communications>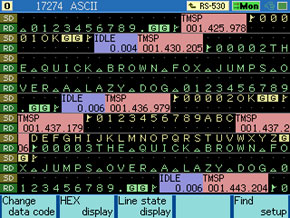 |
<Example of X.25 protocol translation> |
Display of Two Divided Areas for Ease of Comparison [New Function]
It is possible to scroll the two divided areas on the upper half and lower half of the screen individually or simultaneously, which allows the comparison of the two communications records efficiently.
Freely Set with Four Effective Digits for Transmission and Reception
The required conditions of transmission or reception data, such as the bit configuration, bit transfer sequence, polarity, and modulation format can be freely selected to meet many test situations.
Support Modbus protocol and PROFIBUS protocol for field bus
Modbus
Diverge Modbus communication on RS-485 line and measure by the analyzer.
| It can detect 3.5 character time of idle state as frame gap and separate message frames properly even in the high-speed Modbus communication. Support Modbus-ASCII and Modbus-RTU telegram structure. It automatically starts the LRC/CRC frame check according to the data format, and know the errors and error triggers. HEX display and also translation display of address and function are available. |
< Modbus configuration > |
< Modbus in HEX > |
< Modbus in Translation display > |
PROFIBUS
It supports monitoring and simulation of PROFIBUS which is widely used for industrial fieldbus (with the firmware Ver1.18 or later). Setting the protocol to PROFIBUS, with the communication condition which follows the standard of PROFIBUS, it judges the FCS of PROFIBUS standard (which varies depending on the data format) by detecting idle time of 33 bit or more and separating PROFIBUS communication frames. You can also observe the flow of the communication by PROFIBUS translation display or dump display in addition to the normal monitoring display. Note: The communication speed defined in PROFIBUS standard is 9600bps to 12Mbps, however the standard firmware of LE-8200(A) supports up to 4Mbps. To monitor faster communication such as 6Mbps or 12Mbps, OP-FW12GA (to be released in Jan. 2015) is needed. |
< PROFIBUS configuration > |
< PROFIBUS in HEX > |
< PROFIBUS in Translation display > |
User Defined Translation Display [Ver1.05 or upper]
User defined translation function translates frame data at specified position to the user defined characters or numbers. It helps users to analyze the unique protocol format.
| < Previous Display > |
< User Defined Translation Display > |
High-precision Time Stamp Recorded at 1-μs Intervals [New Function]
The time stamp shows the transmission or reception time of the head data of each communications frame. In addition to the Hr/Min/Sec time stamp, the LE-8200 incorporates Year/Mon/Hr/Min/Sec time stamp. Also, there is a high-precision time stamp that records the elapsed time of transmission or reception at minimal 1-μs intervals from the start of measurement.
This function has widened the range of applications from the narrowing down of data on a specified time-and-date basis and delicate timing basis. In addition, it is possible to judge each frame in asynchronous communications by specifying an idle time of 1 to 100 ms or frame end data.
[ Real-time Time Stamp ]
| Hr/Min/Sec Recording Type (compatible with lower models)
| Expansion Recording Type
|
[ Elapsed Time Stamp ]
TMSP 005.398.614 |
| 5seconds 398milliseconds 614microseconds |
Idle time display is ideal for checking the response time and timeout of transmission or reception a a glance.
[ Idle Time Display ]
IDLE 02.78 |
IDLE 0.046 |
| 2.78seconds | 0seconds 046milliseconds |
Long Recording Time Allowing Rolling back to Points of Communications Failures
The LE-8200 has 100MB internal capture memory that gains high-speed access to megaspeed communications, and is provided with ring and fixed buffer modes.The user can select the ring buffer mode for endless recording or the fixed buffer mode to stop recording automatically when the memory is full. Furthermore, the LE-8200 incorporates an auto save function that makes it possible to save the monitored content of internal memory on a high-capacity compact flash (CF) card in a specified file size continuously.
This is useful for identifying communication failures which occur at rare intervals.
| Applicable transmission speed | Continuous recording time reference *1 | ||
|---|---|---|---|
| Main memory only | 16GB CF card *2 | 64GB CF card *3 | |
| 9600bps | Approximately 6 hours | Approximately 38 days | Approximately 154 days |
| 115.2Kbps | Approximately 30 minutes | Approximately 78 hours | Approximately 312 hours |
| 1Mbps | Approximately 220 seconds | Approximately 10 hours | Approximately 20 hours |
both transmission and reception data will consume 4-byte memory for each capture.
Supporting Logic Analyzer Analysis and Analog Waveform Analysis [New Function]
The logic analyzer, which digitally displays the waveforms of communications line timing, operates at
a sampling rate up to as high as 100 MHz. Furthermore, this feature realizes the simultaneous display
of 12 lines by making use of the large-sized screen.
Besides, the adoption of function keys ensures the operation of the time cursor with ease.
Furthermore, if the OP-SB85L optional expansion kit is used, measurement of analog voltage waveforms at a maximum rate of 40M samples per second will be possible.
Therefore, you will be able to realize detailed waveform observation without carrying a heavy general-purpose measuring instrument when you are on a business trip.
These functions help to identify hardware problems.
You can also use it for educational purposes, comparing documents for communications protocol.
[Example of Logic Analyzer Analysis] |
[Example of Analog Waveform Analysis] |
Trigger Function with Detection Capability Reinforced Twice [Functional Enhancement]
Trigger 5
The trigger function controls the operation of measurement when the function detects specific communications status.
Conventional models have four combinations of trigger conditions and trigger actions.
On the other hand, the LE-8200 is provided with eight combinations for ease of making settings that are more flexible.
This function not only enables the detection of eight types of conditions simultaneously but also makes it possible to detect particular conditions in sequence.
Complicated communications events can be precisely grasped.
[Contents of trigger settings]
| Trigger 0 | External trigger output in case of error generation . |
|---|---|
| Trigger 1 | Saves the data before and after idle time on the CF card when the idle time exceeds the set value. |
| Trigger 2 | Starts timer 0 when the specified signal line is 1. |
| Trigger 3 | Stops timer 0 when the specified signal line is 0. |
| Trigger 4 | Enables trigger 5 when start flags 01h, 02h, 03h, and F1h or 01h, 02h, 03h, and F3h are detected in sequence in SD. |
| Trigger 5 | Stops measurement immediately when 58h, 59h, 5Ah, arbitrary 2-byte data, and the end flag are detected in sequence in RD. |
| Trigger 6 | Stops measurement when timer 0 coincides with the set value. |
Voltage Measurement of Communications Line with Ease [New Function]
The feature is added with a function to measure the maximum, minimum, and present voltage amplitudes of SD, RD, DTR, and external EXT signals over RS-232C.
This allows ease of the voltage amplitude measurement of wiring in connectors where the probes of testers cannot reach smoothly, thus contributing to the investigation of communications trouble caused by an insufficiency in the amplitudes of signals resulting from a circuit voltage drop.
Graphic Display of Hourly Communications Status
Therefore, it is possible to grasp not only the change of communications traffic (the rate of line usage) but also the number of transmission and reception times of specific data strings and the occurrence frequency tendency of errors on a time zone basis.
Furthermore, the auto range display with increased graphic resolution allows ease of seeing slight changes.
Simulation function provides the actual operating environments
With the simulation feature, LINEEYE protocol analyzers act as the counterpart to the target device and perform transmission and reception tests according to protocol.
Even in the early stages of development when matching devices are not available, it provides six types of simulation modes.
Error handling process can be checked by sending data with parity errors. Margins can be evaluated by intentionally shifting communications speed.
For example, test the 9600bps target device at 9840bps speed. In addition, data transmission can be linked with the changes in the signal lines, and an automatic control of RS-485 transmission driver IC is supported.
Furthermore, it offers half-duplex simulation mode, which will be useful for communication test of half-duplex RS-485. For example, when a communication test uses only SD line, it can sort the sending data of the analyzer to SD line and the receiving data from the opposite device to RD line. This allows you to execute communication tests which use trigger function or instruction of program mode.
MANUAL mode
While checking replies from a unit under development with the monitoring feature, you can easily and simply test the communications process.
You can also send fixed data by registering it under a key combination of the SHIFT and "0" to "D" keys, as well as turn RTS/CTS and DTR/DCD signal lines on/off with the SHIFT and "E"/"F" key combinations.
BUFFER mode
This mode is effective in conducting reproducibility tests using the same data as that monitored under actual communications conditions.
FLOW mode
In the transmission mode, up to 16 cycles of data from transmission start until a generated interrupt request can be displayed.
In the reception mode, you can set the number of received data cycles until a transmission interrupt request is generated, as well as the time until the transmission resume request is generated.
ECHO mode
Buffer echo to send back data by a frame, character echo to send back data by a character and loop back echo to return by the hardware can be selected.
It is used to test display terminals and communications terminals.
POLLING mode
In the master mode, they send polling messages to 32 slave units, and check and display replies from each slave.
PROGRAM mode
By creating a purpose-specific command program, the communications protocol can be flexibly simulated alongside condition monitoring.
The program is created using the menu selection, so it is easy to master.
[PROGRAM mode setup] |
Meaning 027: Label20 028: Wait new receiving frame 029: Transmit data table 08 030: If receiving [CR, LF, O, K, CR, LF], jump to label 025 031: Set register3 +1 032: If value of register3 is equal to register0, jump to label 030 033: Jump to label 020 034: transmit [SX, 1, 2, 3, A, B, C, EX] |
[ Dedicated Commands Table ]
| Command | Operation |
|---|---|
| NOP | No Operation. |
SEND CHR  |
Data communications up to 8 characters. |
| SEND TBL |
Data communications of the specified transmission data table. |
| SEND REG GRP |
Data communications of the transmission data table specified by a register value. |
| SEND BUF | Transmits data in the frame buffer. |
| SEND KEY GRP |
Transmits data in the transmission data table corresponding to keystroke. |
| SEND DA +REG |
Transmits data of the data array specified by additional value of preset value of the data array number and the value specified by register number. |
| SEND BRK | Transmit a break signal (for only ASYNC) |
| SEND FRM | Transmits a X.25 frame. |
| WAIT CHR |
Waits for the particular character string of up to 8 characters to be received |
| WAIT FRM (CLR/NOCLR) | Waits for a frame to be received. |
| WAIT TRG |
Waits for a specified trigger condition to be specified. |
| WAIT TM |
Waits for a specified period of time. |
| WAIT KEY | Waits until one of the keys from 0 to F is pressed. |
| WAIT LN = |
Waits until the logical values of the control lines meet with the setting. |
| WAIT MLT | Executes multiple WAIT commands. If one WAIT command is satisfied, all WAIT commands will be released. |
| GOTO L |
Jumps to a specified label number. |
| IF CHR L |
Branches to a specified label number if the particular character string is included in the frame buffer. |
| IF TRG L |
Branches to a specified label number if the trigger conditions are satisfied. |
| IF TM L |
Branches to a specified label number if the timer exceeds the setting value. |
| IF CT L |
Branches to a specified label number if the counter exceeds the setting value. |
| IF LN = L |
Branches to a specified label number if the logic values of control lines meet with the setting. |
| IF REG L |
Branches to a specified label number if the inequality relation between registers is satisfied, or register value is matched with the constant value. |
| IF TBL L |
Branches to a specified label number if it is satisfied with data of table specified by the table number. |
| IF DA +REG L |
Branches to a specified label number if data in the frame buffer is satisfied with data in the data array specified by the additional value, which is the sum of the designated value of a data array number, and the value designated in the register number. |
| IF FT L |
Branches to a specified label number if a frame stored in the reception frame buffer is matched with the specified type. |
| CALL L |
Jumps to a subroutine marked with a specified label number. |
| RET | Returns from the subroutine. |
| SET REG |
Sets a value to register, or increments or decrements the register. |
| SET LN = |
Sets a value of the control line. |
| SET TM |
Sets a value to the timer, or controls the start, the stop or the restart of the program. |
| SET CT |
Sets a value to the counter, or increments or resets the counter. |
| SET BZ | Sets the buzzer. |
| SET OUT | Outputs a pulse to the trigger out terminal. |
| SET DA |
Sets data to the data array. |
| SET DV REG |
Sets the specified number of characters on contents in register as a character string to the data array. |
| SET MOD (8/128) | Sets a frame modulo for X.25 program simulation. |
| SET AD |
Sets the address field of a frame transmitted by SEND FRM command. |
| SET VS |
Sets or changes the value of V(S) state valuable. |
| SET VR |
Sets or changes the value of V(R) state valuable. |
| SET PF |
Sets the P/F bit value of a frame transmitted by SEND FRM command. |
| SET DP |
Sets or changes the data pointer. |
| INT TRG 0 L |
Jumps to the subroutine marked by the specified label number when the condition of trigger 0 is satisfied. |
| RETI L |
Returns from subroutine started by the INT command. |
| DISI TRG 0 | Disables an interruption. |
| STOP | Stops the running of simulation operation. |
| L |
Enters a label number in a range from 0 to 999 in decimal notation. |
The highlighted commands are available from firmware version 1.13 or above.
[ Special Register ]
| ST | Value of WAIT command which releases the WAIT status of the WAIT MLT command. |
| KY | Value (0 to 15) corresponds to the [0] to [F] keys, which are inputted while executing the WAIT KEY command. |
| DL | Number of data in the received frame executed by WAIT FRM command. |
| DT | Data of received frame executed by WAIT FRM command. |
| AD | Address value of received frame executed by WAIT FRM command. |
| NS | N(S) field value of received frame executed by WAIT FRM command. |
| NR | N(R) field value of received frame executed by WAIT FRM command. |
| PF | P/F field value of received frame executed by WAIT FRM command. |
BERT(Bit Error Rate Test)
BERT function enables you to evaluate parameters (bit error count, block error count) conforming to ITU-T G.821 Notification, hence enabling error rate evaluation and fault point identification.
Elaborate test patterns and functions such as bit error forced interrupt are comparable to dedicated equipment.
[Contents of BERT measurement]
| Savail | Available measurement in seconds | 0 - 9999999(sec) |
|---|---|---|
| Receive bit | Effective bits received | 0 - 9999999 - 9.99E9 |
| Error bit | Error bit count | 0 - 9999999 - 9.99E9 |
| Bit error rate | Bit error rate | 0.00E-0 - 9.99E-9 |
| Sync loss | SYNC loss count | 0 - 9999 |
| Receive block | Block error count | 0 - 9999999 - 9.99E9 |
| Error block | Block error rate | 0 - 9999999 - 9.99E9 |
| Block error rate | Effective blocks received | 0.00E-0 - 9.99E-9 |
| Error second | Error second | 0 - 9999999(sec) |
| %E.F.S | Normal operation rate | 0.000 - 100.000(%) |
Many of test patterns
Three patterns are added for longer measurement period.
Graphs for specified measurement period
The movement of graph enables you to check the error rate easily.
PC Link
Using the light-edition of PC-link software "LE-PC800G (Light Edition)", you can convert the captured data in a CF card or a USB flash (LE-8200A only) into a text file by your PC. You can also display the data on your big PC monitor.
The software not only supports the serial communication and USB as its connection between a PC and the analyzer but also supports connection via a serial-LAN converter. It helps you to easily compose a remote monitoring system in which you can utilize multiple analyzers on a network at the same time.
The LE2-8V AUX cable provided to the analyzer is available in the case of serial connection.
An interface to read the CF card is required on the PC side.
 |
*1 SI-60 is a LAN-serial converter supported by LE-PC800G. Target analyzer is identified by specifying IP address of SI-60 on the remote setting window of LE-PC800G.
*2 optional AUX cable for DSUB 25-pin(LE2-8C). Set the DTE/DCE switch of SI-60 to DTE. |
Develop customer application
Acquires monitored data,
connection, measurement,
key-emulation in CSV format.
This library for LE-series is available for VisualC++ and Visual Basic.
It may shorten the time to develop customer application system linking with another software.
[ Example of function ]
| LEConnect | Connect to LE-series |
| LEGetSetup | Acquire configuration of LE-series |
| LESetTable | Set transmission data/table |
| LEGetProgram | Acquire program/data |
| LEStartMeasure | Start measurement |
| LEGetMonitorData | Acquire monitored data |
| LEEmulationKey | Emulate key operation of LE-series |
This library is for controlling some of the functions in the LE-series from user application.
Acquires monitored data after the measurement.
[ Add real time library ]
Real time library is now available from LINEEYE web site. It is useful when developing your own inspection system etc.
This library is provided for free. However, any inquiries regarding to this library is chargeable service.
Full of Convenient Functions for Efficient Measurement
Auto RUN / STOP Function
The screen on the right-hand side is set to make
measurement from 5:00 a.m. to 7:30 a.m.
automatically on a daily basis.
This feature is useful for unmanned measurement with only an analyzer left on site.
Monitor Condition Auto Setting
The communications conditions of lines, such as the communications speed and framing of the lines, can be automatically detected if relatively large volumes of communications data with few errors flows in the lines.This is effective for monitoring lines of unknown communications conditions.
* Accurate auto settings will not be possible for small volumes of communications data or data that contains many errors.
File Printout Function [Functional Enhancement]
The continuous printing of measurement data as well as the printing of screen display is possible in an appropriate format selected from a wide variety of formats according to the display mode of the screen.
Printing images of text files and bitmap files can be saved on the CF card if the destination of output is specified as files, thus saving paper resources and making it possible to utilize data on personal computers at the same time.
< Text Conversion > *=[LE-8200]=====[2012-10-17 10:02:15]=* * Model : LE-8200 * * Version : 1.11 * * Extension : Standard * * Serial No.: ******** * * Start time: 2012-09-25 17:44:48 * * Stop time : 2012-09-25 17:46:12 * *-------------------------------------* * MONITOR DATA (MODBUS TRANSLATION) * * PROTOCOL: MODBUS * * SPEED : 19200 * * MODE : RTU PARITY : ODD * *=====================================* ------TM------SA------FUNC/SUBFUNC--------FC----------------DATA--------------- SD:000061499 3 Read holding registers G 006B0001 SD:000069455 3 Read holding registers G 020000 SD:000217404 2 Read holding registers G 006B0001 SD:000225317 2 Read holding registers G 020000 SD:000373416 3 Diag/Query data G 55AA SD:000381369 3 *Diagnostics G 01 SD:000997404 3 Read holding registers G 00B00002 SD:001005428 3 Read holding registers G 0400000000 SD:001153312 2 Read holding registers G 00B00002 SD:001161366 2 Read holding registers G 0400000000 SD:001309380 3 Read holding registers G 00AA0002 SD:001317254 3 Read holding registers G 0403F20000 SD:001465334 2 Read holding registers G 00AA0002 SD:001473117 2 Read holding registers G 0403F30000 SD:001621395 3 Read holding registers G 006B0001 SD:001629077 3 Read holding registers G 020000 SD:001777303 2 Read holding registers G 006B0001 SD:001784943 2 Read holding registers G 020000 SD:002557313 3 Read holding registers G 00B00002 SD:002565054 3 Read holding registers G 0400000000 SD:002713325 2 Read holding registers G 00B00002 SD:002721418 2 Read holding registers G 0400000000 SD:002869390 3 Read holding registers G 00AA0002 SD:002877381 3 Read holding registers G 0403F30000 SD:003025242 2 Read holding registers G 00AA0002 |
File Management Function
This functions supports file sorting and filtering, thus greatly improving file search performance. Moreover, the LE-8200 is safely designed.
Therefore, if an automatic backup is set, measurement data will be saved automatically on completion of measurement.
Firmware updating
The latest firmware with additional functions and improvements can be found on our website.
Support to new communications standards and new functions with no interface change will be available by simply updating the firmware.
When you download it to your PC, you can update the firmware over the provided serial cable.