
This model is discontinued. The successor is LE-3500XR.
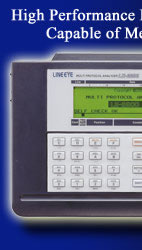
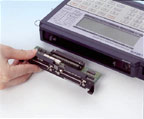
LE-3200-E is a compact protocol analyzer equipped as standard with Max. online monitoring, simulation, and BERT. It enables a measurement test for a communication circuit at max. 1.544Mbps. In addition, it is the upgraded model of LE-3100 and has been CE marked.
| See options | LE-PC300G | Interface Sub Board | Option Table | |
| See details on product | Specifications | Appearance | Standard Accessories |
[ Features ]
| Enables measurement at max. 1Mbps (Full duplex). | |
| Equips RS-232C and RS-422/485 (RS-530) as a standard. | |
| Supports X.21 and RS-449 by use of the dedicated cable only . | |
| 3.6MB memory, the compact flash card (max. 2GB) makes it possible to continuously record more measurement data | |
| PC Link software that enables communication between the analyzer and a PC. | |
| The 2.5 hours recharge enables the analyzer operate for approx. 8 hours. | |
| Approx 950g |
Mega Speed Measurement
| You can test measurement of high-speed communications up to 1.544Mbps (half duplex) or 1.000Mbps. Using high precision DPLL technology for open baud rate support, transmission and reception speed can be separately set to an effective 4 digits. | < Baud rate setting display
> |
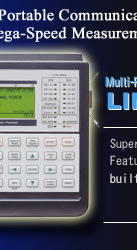
Multi-Protocol Support
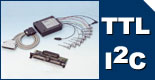
Multi-Protocol Support is Provided as a standard FeatureLE-3200-E comes standard with measurement interface for RS-232C (V.24) and RS-422/485 (RS-530) standards. X.21, RS-449 and V.35 require only a dedicated cable.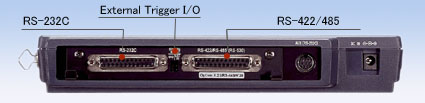  |
|||||||||||
< Protocol setup > |
< Interface setup > |
||||||||||
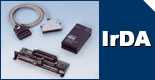
Expansion Kit Broadens the Range of UseProtocols of differing hardware specifications are supported by simply changing the measurement board.
|
|||||||||||


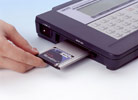
Auto Save... Long Recording Time
| Built-in memory
card (PC card) interface |
Memory card 2GB |
|---|---|
 |
MC-2GCF |
*Before using MC-2GCF
If you are using LE-3200-E with the version such as 1.09 or before, please update to 1.10 or later.
Firmware is available for downloading from the support page.
*When 1 kilobyte data is repeatedly transmitted by full duplex with intervals of 1m second idle time for each. Both transmission and reception data consume 4 byte of memory for each capture.
If you are using LE-3200-E with the version such as 1.09 or before, please update to 1.10 or later.
Firmware is available for downloading from the support page.
| Target Line Speed (bps) |
Continuous Recording Time Reference | |||
|---|---|---|---|---|
| Main Monitor Only | When Using MC-512CF |
When Using MC-1GCF |
When Using MC-2GCF |
|
| 9600 | Approx. 40min. | Approx. 30hrs. | Approx. 60hrs. | Approx. 120hrs. |
| 115.2K | Approx. 200sec. | Approx. 2.5hrs. | Approx. 5hrs. | Approx. 10hrs. |
| 1M | Approx. 26sec. | Approx. 19min. | Approx. 38min. | Approx. 76min. |
Logic Analyzer Display
Analyzes timing trouble in bits
| Communication line timing is
analyzed and displayed as a logic analyzer display to a
time resolution of max. 50ns. This function helps to
identify the problems with hardware. Also, you can use
it as educational use, comparing documents for
communications protocol. |
< Logic analyzer display
> Measurement between the cursors at 12 micro sec. |
PC Link
Use measurement data on PC via dedicated application.Manipulate measurement data on your own PC. By connecting the serial cable, the measurement log is recorded to HDD of a PC (*1). Moreover, the record log on a memory card are converted to the text format on a PC (*2) to use.
*1:Requires an option, PC software
(LE-PC300G).
*2:Includes software with the analyzer for converting saved data on the memory card to the text format and capturing the text output (printing data) from the analyzer.
(*) LE-3200-E
*2:Includes software with the analyzer for converting saved data on the memory card to the text format and capturing the text output (printing data) from the analyzer.
(*) LE-3200-E
Online Monitoring
The online monitor feature records communications data in the capture memory and provides an easy-to-understand display for the type of protocol, without affecting the communication line. LINE EYE protocol analyzers record not only communications data but the time (time stamp) of transmission and reception as well as idle time. Therefore, failure time and timeout status can be checked. In addition, it is available for the trigger function which detects specific communication conditions and for the recording function to select the specific address frames which helps you to effectively use the memory.Depending on the test, you can select bit transfer sequence and polarity, as well as modulation format from NRZ, NRZI, FMO, FM1 and 4PPM. The feature allows to support effective analysis by omitting SYN codes and using SDLC/HDLC address filter.
< Time stamp/idle time
display > < IrDA translation display >  < PPP translate display >  < Timing data display >  |
Line State LED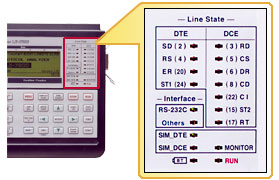 Example of connection for online monitoring |
Time Stamp Measurement
Record the data and the time of transmission / reception for data frames. ASYNC cannot recognize the length of frame. Thus, our analyzers decide the frame end when it find the specific character, or when it pass the specific time of being non-communication. Time stamp will be displayed in above 2 situations.* Specifies OFF, day / hour / minute, hour / minute / second, or minute / second / 10msec.
Non-communication state which works as the frame end detection time of ASYNC and Burst communications can be set from 1 to 100ms.
* The example indicates that received time of last data was 20min. 56.37sec(M / S / 10mS setting)
* If there are some frame with same time stamp, it is because the analyzer measured the frames in 10ms.
Idle Time Measurement
The amount of idle time between communications frames can be measured.* Specifies OFF or a resolution of 100msec., 10msec. or 1msec.
* The example indicates there was an idle time of 7 to 7.9ms(1mS setting)
Trigger Function
The trigger feature allows you to specify
a communications event as the trigger condition and have
measurement operations executed automatically when that
condition is specified. Up to four pairs of conditions
and operations can be set, which is helpful towards
identifying frequent intermittent faults that occurs with communications systems.
And, the operation of a trigger condition can be
specified as the condition for another trigger, making
it possible to analyze complicated operations based on
sequential trigger.
|
< Trigger setup
summary display > < Trigger condition setup >  < Trigger action setup >  |
Statistical Analysis Measurement
< Statistically analyzed data
> |
Statistic can be compiled for transmission and reception data sets, frames and the number of established trigger events, and subsequently displayed as a graph (Unit: 1 to 240min.). This helps to understand communications traffic and error frequency for a specific time period. |
Monitor Condition Auto Setting
Communications data received is analyzed. And the following basic measurement conditions are automatically set based on the findings: communication speed, the character framing, data code, SYNC character, BCC/FCS, etc.*Auto setting may be disabled
when there is little data on the communication line or
when data included a lot errors.
*Maximum speed for auto setting is 115.2kbps.
*Maximum speed for auto setting is 115.2kbps.
< Search display > |
< Determination display
> |
Delay Time Measurement
| Enables to measure min. / max. / average time of until some signal state is changed to another state and the number of its times. It is useful for delay analysis of control line RTS-CTS and so on. | < Delay time measurement display
> |
Simulations
With the simulation feature, LINE EYE protocol analyzers act as the counterpart to the target device and perform transmission and reception tests according to protocol. Even in the early stages of development when matching devices are not available, tests can be run at near to actual operatingstatus. After performing the step-by-step check of the communications protocol in the analyzer's ownoriginal MANUAL mode, the developer can create a simple program to branch conditions using the menu selection and test more complicated communications protocols.Example of connection for simulation
<
Control lines and data transmission timing > |
MANUAL Mode
| The manual mode allows you to send data registered in the transmission table which corresponds to the "0" to the "F" keys. Data can be sent with the press of a key. While checking replies from a unit under development with the analyzer's monitoring feature, you can easily and simply test the communications process. You can also send fixed data by registering it under a key combination of the SHIFT and "0" to the "D" keys, as well as turn RS and ER signal lines on/off with the SHIFT and the "E"/"F" key combinations. | < Transmission table setup display
> |
FLOW Mode
| Flow control can be simulated on the transmission and reception-lines using X-on/off flow control or the control line handshake. In the transmission mode, up to sixteen cycles of data from transmission start until a generated interrupt request can be displayed. In the reception mode, you can set the number of received data cycles until a transmission interrupt request is generated, as well as the time until the transmission resume request is generated. | < Flow mode setup display
> |
ECHO Mode
In the echo mode, the analyzer internally return received data in units of bits, bytes or frames (character string). It is used to test display terminals and communications terminals, and to set loop-back points for the BERT feature.POLLING Mode
| The polling mode simulates the slave and master units in multidrop (1:N connection) polling protocols. In the slave mode, the analyzer check the number of received frames that are assigned their address and whether errors occur or not, replying with user-set data. In the master mode, they send polling messages to thirty two slave units, and check and display replies from each slave. | < Polling setup > |
BUFFER Mode
| In the buffer mode, you can select transmission or reception, and send transmitted and received data that has been captured in the buffer using the unit's monitoring capabilities, as simulation data without requiring further manipulation. This mode is effective in conducting reproducibility tests using the same data as that monitored under actual communications conditions. | < Buffer data reproduction setup
> |
PROGRAM Mode
| By creating a purpose-specific command program, the communications protocol can be flexibly simulated alongside condition monitoring. The program is created using the menu selection, so it is easy to master. | < Program display > |
| Command | Operation |
|---|---|
SEND CHR  |
Sends max. 8 data sets. |
| SEND REG |
Sends data registered in transmission table under specified REG No. |
| WAIT CHR |
Waits until receiving specified data (max. 8 data sets). |
| WAIT FRM | Waits until receiving 1 frame. |
| WAIT TM |
Waits for specified amount of time. |
| GOTO L |
Jumps to specified label No. |
| CALL L |
Jumps to subroutine of specified label No. |
| IF CHR L |
Branched if specified data in reception buffer. |
| IF LN = L |
Branches if interface line is specified logic. |
| SET REG |
Sets or increases/decreases value of specified REG No. |
| SET TM |
Controls specified timer and sets to specified value. |
| INT TRG 0 L |
Interrupts specified label when trigger 0 condition is satisfied. |
BERT(Bit Error Rate Test)
BERT support enables you to measure transmission quality of communications lines by a loop-back or interactive connection. It is possible to measure evaluation parameters (bit error count, block error count) conforming to ITU-T G.821 Notification, hence enabling bit error rate evaluations and fault point identification. Elaborate test patterns and functions such as bit error forced interrupt are comparable to dedicated equipment.< BERT display > This function allows to analyze in the ASYNC or SYNC mode by selecting test mode (CONTINUE, R-BIT, RUN TIME and Repeat) and test patterns. < BERT measurement display >  Starting measurement updates the measured results of line quality in real time. With REPEAT mode, you can know the bit error rate of every specific time on a communication circuit. |
Example connection for BERT |
| Communication mode | Can select the ASYNC or SYNC mode. | ||||||||||||||||||||||||||||||
|---|---|---|---|---|---|---|---|---|---|---|---|---|---|---|---|---|---|---|---|---|---|---|---|---|---|---|---|---|---|---|---|
| Test Pattern |
|
||||||||||||||||||||||||||||||
| Pattern | 26-1, 29-1, 211-1, MARK, SPACE, ALT, DBL-ALT, 1in4, 1in8, 1in16, 3in24 | ||||||||||||||||||||||||||||||
| Measured Data |
|
Menu-Based Simple Operation
| Anyone can easily operate the analyzer owing to the easy menu selection system handed down from earlier models. | < Top menu display > |
Offline Analysis Data Searches
Measurement data display can be freely scrolled and paged. A powerful search feature allows you to locate specific data and perform counting.| Search Key | Communications error (individual error type can be specified), communications data string of max. 8 characters (DON'T CARE and bit mask can also be specified), idle time beyond a specified duration, specific time stamp (DON'T CARE can also be specified), trigger matching data |
|---|---|
| Search Operation | Find and display, counting |
< Search key setting
> |
Using "DON'T CARE (*)," you can search for time stamp data from 10:30:00 to 10:39:59 as in this example. |
PC Compatible File Management Specification
Test conditions and results such as measured data can be saved on microdrives, compact flash cards and other memory cards in the file management format compatible with your PC. Of course, files can be interchangeably used between models such as LE-7200-E, LE-3200-E, LE-2200-E, and LE-1200-E. Therefore, measurement data can be saved on-site with LE-3200-E, and analyzed or manipulated in greater detail using LE-7200-E back in the office.* Not available to use memory cards for LE-1100-E.
| This function allows you to check files saved into memory cards by type, name, size, and/or date. | < File operation display
> |
| File type | Measurement data
(.DT), Trigger save data (TG SAVEnn. DT), Auto save data (#nnnnnnn. DDT), Measurement Conditions (.SU), Transmission data for simulation (.ST), Simulation Program (.SP) |
|---|---|
| File operation | Displaying normal file or designated type of files, Save, Load, Deletion, Format |
| When there are so many files
saved in a memory card, this function enables you to
specify the types of files you wish to display on the
screen. This image shows the
setup to display the trigger save data only from
Feb. 14, 2005 at 12:00 to Feb. 14, 2005 at
20:59. |
< File filter setup
> |
Updating to Firmware
You can download the latest version of software from our website to take advantage of the >DownloadAuto RUN/STOP for Unmanned Measurement
| By setting time and a data of measurement start and end, measurement can be done automatically during the specified time period. | < Auto run display > |
Various Print Formats
| Measurement data of a user-specified range can be printed out continuously from any printer. And, with a dedicated printer, you can print hard copy images of computer displays and continuous images of logic analyzer waveforms. | < Print out setup> |
| Printing Sample image | sample1 | sample2 | sample3 | sample4 |