Compact, Light, Mega Speed, Long Recording
Multi Protocol Analyzer
LINEEYE
LE-3500
Perfect model with statistical Analysis
function and program simulation
Max Speed 1.544Mbps(full duplex)
Capture memory 6.4MB, Max 16GB CF
Analysis timing troubles
lack of signal voltage
790g, A5-size, battery driven 8 hours
| LE-3500 | : | Japanese model ( contains Japanese manual ) |
| LE-3500-E | : | World wide model ( contains English manual ) |
LINEEYE released the first LE-series model in 1986. Since then, LINEEYE has been developing the LE Series protocol analyzers in response to the requirements of a large number of customers, and now come to the fruition of the LE-2500 and LE-3500, the newly designed latest models realizing great downsizing with a sharp reduction in weight.
It incorporates versatile analysis functions and excellent portability, thus fully supporting the development tests, after-sale services and trouble analysis. LE-series have been used in the industries of railways, aviation, and a variety of manufactures for few decades. With optional kits, it can be used for developing in-vehicle and embedded devices. Unlike the software based analyzers, it cannot be affected by the capability of PC and can be used in the place where PC is not allowed.
Mega Speed Measurement
Multi-Protocol Support
Multi-Protocol Support is Provided as standard Features
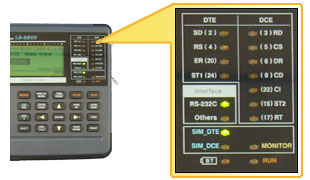
LE-3500 works as a serial port monitor/simulator, comes standard with measurement interface for RS-232C (V.24) and RS-422/485 (RS-530) standards. X.25, RS-449 and V.35 require only a dedicated cable.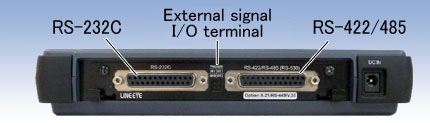
<Protocol setting display> |
<Interface setting display> |
Expansion kits supports TTL, I2C, IrDA, CAN and LIN
Protocols of differing hardware specifications are supported by simply changing the measurement boards.
Simply pull out the interface board from the measurement unit and replace it with an expansion board for another protocol. |
OP-SB5GL | OP-1C+SB-25L | |
 TTL TTLI2C |
 Current CurrentLOOP |
||
| OP-SB6G | OP-SB7GX | ||
 IrDA IrDAASK |
 CAN CANLIN |
Support Modbus communication for Field bus protocol [ Ver1.07 or above ]
Diverge Modbus communication on RS-485 line and measure by the analyzer.
| It is able to measure high-speed Modbus communication, detecting idle time for 3.5 characters which will be a frame end. Support Modbus-ASCII and Modbus-RTU telegram structure. LRC/CRC frame check are automatically made according to the data format, and error check/error trigger are available. |
<Example of usage of analyzer for Modbus communication> |
<Normal display of Modbus> |
<Frame display of Modbus>  |
Auto Save... Long Recording Time
| Built-in memory card interface |
Memory card 16GB |
|---|---|
 |
CF-16GX |
| Target Line Speed (bps) |
Continuous Recording Time Reference*1 | |
|---|---|---|
| Main memory Only | When Using CF-8GX | |
| 9600bps | Approx. 22min. | Approx. 480hrs. |
| 115.2Kbps | Approx. 110sec | Approx. 40hrs. |
| 1Mbps | Approx. 14sec | Approx. 5hrs. |
Logic Analyzer Analysis And Signal Voltage Measurement
Communication line timing is analyzed and displayed as a logic analyzer display to a time resolution of max. 50ns. The new function of signal voltage measurement ensures ease of the voltage measurement of RS-232C signals in places where tester probes cannot reach smoothly.
PC Link
| The LE-PC300G supports serial connections through the COM port, USB connections, and LAN connections via LINEEYE SI-60 converter, thus enabling remote measurement by multiple analyzers connected at the same time. It also allows you to browse measurement data saved in memory card and convert data. | 
*1) SI-60 is a LAN-serial converter supported by LE-PC300G. Target analyzer is identified by specifying IP address of SI-60 on the remote setting window of LE-PC300G. *2) optional AUX cable for DSUB 25-pin(LE2-8C). Set the DTE/DCE switch of SI-60 to DTE. |
*1)
The PC Link software is not provided with a USB cable. Prepare a USB cable if you intend to use USB connection. The LE2-8V AUX cable provided to the analyzer is available in the case of serial connection. *2) An interface to read the CF card is required on the PC side. |
Online Monitoring
LINE EYE protocol analyzers record not only communications data but the time (time stamp) of transmissions and receptions as well as idle time. Therefore, failure time and timeout status can be checked.
As a standard feature, the analyzer support various communications standards from asynchronous to packet switching systems.
Depending on the test, you can select bit transfer sequence and polarity, as well as modulation format from NRZ, NRZI, FMO, FM1 and 4PPM. The feature allows to support effective analysis by omitting SYN codes and using SDLC/HDLC address filter.
 <Time stamp / idle time display>  <Example IrLAP protocol translation>  <Example PPP translattion>  <Timing data display>  |
Special data items are
Display special data items, such as errors and HDLC frags etc. in individual signs.
|
| HDLC/SDLC flag | |
| Short Frame | |
| Block check code (Normal) | |
| Block check code (Abnormal) | |
| Parity error | |
| Framing error | |
| Parity and Framing Error | |
| Break |
Line State LED
communications line state is indicated in real time using 2-color LEDs
Time Stamp Measurement
Record the data and the time of transmission / reception for data frames. ASYNC cannot recognize the length of frame. Thus, our analyzers decide the frame end when it finds the specific character, or when it passes the specific time of being non-communication. Time stamp will be displayed in above 2 situations.* Specifies OFF, day / hour / minute, hour / minute / second, or minute / second / 10msec.
Non-communication state which works as the frame end detection time of ASYNC and Burst communications can be set from 1 to 100ms.
* If there are some frame with same time stamp, it is because the analyzer measured the frames in 10ms.
Idle Time Measurement
The amount of idle time between communications frames can be measured.* Specifies OFF or a resolution of 100msec., 10msec. or 1msec.
Trigger Function
The trigger feature allows you to specify
a communications event as the trigger condition and have
measurement operations executed automatically when that
condition is specified. Up to four pairs of conditions
and operations can be set, which is helpful towards
identifying frequent intermittent faults that occurs with communications systems.
And, the operation of a trigger condition can be
specified as the condition for another trigger, making
it possible to analyze complicated operations based on
sequential trigger.
|
<Trigger setup
summary display> <Trigger condition setup>  <Trigger action setup>  |
Statistical Analysis Measurement
<Graph of Statistically analyzed data> |
Statistics can be compiled for transmission and reception data sets, frames and the number of established trigger events, and subsequently displayed as a graph (Unit: 1 to 240min.). This helps to understand communications traffic and error frequency for a specific time period. |
Monitor Condition Auto Setting
The analyzers can analyze communications data and automatically set basic measuring conditions, such as communications speed, character framing, data code, synchronization character, BCC/FCS, etc. This is effective for monitoring lines of unknown communications conditions.<Search display> |
<Determination display> |
Delay Time Measurement
| A feature to measure the voltage of four RS-232C signal lines has been added to the conventional delay time function used to analyze the delay time of control line changes (e.g., RTS to CTS changes) at a resolution of 0.1ms. | <Delay time measurement> |
Simulations
| With the simulation feature, the
LINE EYE protocol analyzers act as the counterpart to
the target device and perform transmission and reception
tests according to protocol. Even in the early stages of
development when matching devices are not available,
tests can be run at near to actual operating status.
After checking the communications protocol step by step in the analyzer's own original
MANUAL mode, a developer can create a simple program
to branch conditions using menu selection and test
more complicated communications protocols. Communications speed can be freely set. Therefore, margins can be evaluated by intentionally shifting communications speed, and error response processing can be checked using test data that mixes in data with parity errors.
|
Example of connection
|
MANUAL Mode
| The manual mode allows you to send the data registered in the transmission table which corresponds to the "0" to the "F" keys. The data can be set with one press of a key. While checking replies from a unit under development with the monitoring feature, you can easily and simply test the communications process. You can also send fixed data by registering it under a key combination of the SHIFT and "0" to "D" keys, as well as turn RTS/CTS and DTR/DCD signal lines on/off with the SHIFT and "E"/"F" key combinations. | < Transmission table setup display
> |
FLOW Mode
| Flow control can be simulated on the transmission and reception-lines using X-on/off flow control or the control line handshake. In the transmission mode, up to 16 cycles of data from transmission start until a generated interrupt request can be displayed. In the reception mode, you can set the number of received data cycles until a transmission interrupt request is generated, as well as the time until the transmission resume request is generated. | <Flow control test setup display> |
ECHO Mode
| In the echo mode, the analyzer internally return received data. Buffer echo to send back data by a reception frame, character echo to send back data by a character and loop back echo that simply loops back data can be selected. It is used to test display terminals and communications terminals. | <ECHO mode setup display> |
POLLING Mode
| The polling mode simulates the slave and master units in multidrop (1:N connection) polling protocols. In the slave mode, the analyzer check the number of received frames that are assigned their address and whether errors occur or not, replying with user-set data. In the master mode, they send polling messages to 32 slave units, and check and display replies from each slave. | <Polling setup display> |
BUFFER Mode
| In the buffer mode, you can select transmission and reception, and send transmitted or received data that has been captured in the buffer using the unit's monitoring capabilities, as simulation data without requiring further manipulation. This mode is effective in conducting reproducibility tests using the same data as that monitored under actual communications conditions. | <Buffer data reproduction setup
display> |
PROGRAM Mode
| By creating a purpose-specific command program, the communications protocol can be flexibly simulated alongside condition monitoring. The program is created using the menu selection, so it is easy to master. | <Program display> |
| Command | Operation |
|---|---|
SEND CHR  |
Sends max. 8 data sets. |
| SEND REG |
Sends data registered in transmission table under specified REG No. |
| SEND TBL |
Sends specified transmission data table. |
| SEND BRK | Sends break signals (only for ASYNC) |
| WAIT CHR |
Waits until receiving specified data (max. 8 data sets). |
| WAIT FRM | Waits until receiving 1 frame. |
| WAIT TM |
Waits for specified amount of time. |
| GOTO L |
Jumps to specified label No. |
| CALL L |
Jumps to subroutine of specified label No. |
| IF CHR L |
Branched if specified data in reception buffer. |
| IF LN = L |
Branches if interface line is specified logic. |
| SET REG |
Sets or increases/decreases value of specified REG No. |
| SET TM |
Controls specified timer and sets to specified value. |
| INT TRG 0 L |
Interrupts specified label when trigger 0 condition is satisfied. |
BERT(Bit Error Rate Test)
BERT support enables you to measure transmission quality of communications lines by a loop-back or interactive connection. It is possible to measure evaluation parameters (bit error count, block error count) conforming to ITU-T G.821 Notification, hence enabling bit error rate evaluations and fault point identification. Elaborate test patterns and functions such as bit error forced interrupt are comparable to dedicated equipment.<BERT setting display> Evaluation is possible in ASYNC or SYNC mode, by specifying measurement period (continuous, received bits, duration) or test pattern. <BERT measurement display>  Once started, the results of measured line quality are displayed and updated in real time. |
Example connection for BERT |
| Communication mode | Can select the ASYNC or SYNC mode. | ||||||||||||||||||||||||||||||
|---|---|---|---|---|---|---|---|---|---|---|---|---|---|---|---|---|---|---|---|---|---|---|---|---|---|---|---|---|---|---|---|
| Test Pattern |
|
||||||||||||||||||||||||||||||
| Pattern | 26-1, 29-1, 211-1, MARK, SPACE, ALT, DBL-ALT, 1in4, 1in8, 1in16, 3in24 | ||||||||||||||||||||||||||||||
| Measured Data |
|
Menu-Based Simple Operation
| Anyone can easily operate the analyzer owing to the easy menu selection system handed down from earlier models. | <Top menu display> |
Offline Analysis and Data Searches
| Search Key | Communications error (individual error type can be specified), communications data string of max. 8 characters (DON'T CARE and bit mask can also be specified), idle time beyond a specified duration, specific time stamp (DON'T CARE can also be specified), external trigger matching data |
|---|---|
| Search Operation | Find and display, counting |
<Search key setting> |
Using "DON'T CARE (*)," you can search for time stamp data from 10:30:00 to 10:39:59 as in this example. |
PC Compatible File Management Specification
Test conditions and results such as measured data can be saved on optional CF cards in the file management format compatible with your PC. Of course, files can be interchangeably used between models. Therefore, measurement data can be saved on-site with LE-2500, and analyzed or manipulated in greater detail using LE-3500 back in the office.* The LE-8200A, LE-8200, LE-3500, LE-2500, LE-7200, LE-3200, LE-2200, and LE-1200 are compatible in measurement data file. Part of files or data saved in higher hierarchy models or new models, hower, may not be available in lower hierarchy models or conventional models.
| Types, names, sizes and the data/time of files saved in the memory card can be checked. | <File operation display> |
| File type | Measurement data (.DT), Trigger save data (TG SAVEnn. DT), Auto save data (#nnnnnnn. DDT), Measurement Conditions (.SU), Transmission data for simulation (.ST), Simulation Program (.SP) |
|---|---|
| File operation | Displaying normal file or designated type of files, Save, Load, Deletion, Format |
| When many files have been saved, the file filter feature allows you to specify the type of file to be displayed.
This is set to display data betwen 0:00 on August 1, 2008 and 23:59 on August 31, 2008. |
<File filter setup> |
Updating to Firmware
You can download the latest version of software from our website to take advantage of the latest functions and features. -> DownloadAuto RUN/STOP for Unmanned Measurement
| By setting time and a data of measurement start and end, measurement can be done automatically during the specified time period. | < Auto run display > |
Enable to duvelop your own control systems
Enable toconnect, measure, emulate keys and have monitored data in csv format.
| LEConnect | Connect to LE series |
| LEGetSetup | Get settings of LE series |
| LESetTable | Set trausmission data / tables |
| LEGetProgram | Get programs / data |
| LEStartMeasure | Strat measuring |
| LEGetMonitorData | Get monitored data |
| LEEmulationKey | Emulate keys of LE series |
LE series library is for using some useful functions by user-application. To use all functions of LE series on PC, use LE-PC300G.
Various Print Formats
Measurement data of a user-specified range can be printed out continuously from any printer. And, with a dedicated printer, you can print hard copy images of computer displays and continuous images of logic analyzer waveforms.
Printing Sample image -> sample1 | -> sample2 | -> sample3 | -> sample4