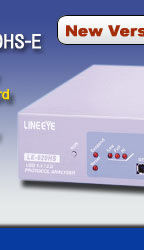
[ Discontinued ]
[ Successor Model: LE-650H2/LE-650H2-A ]
| LE-620HS | : | Japanese model |
| LE-620HS-E | : | World wide model |
 LE-620HS-E is a USB2.0 protocol analyzer which
connects with a PC, and analyzes "USB Protocol." This model supports HIGH/FULL/LOW Speed and continuously records USB2.0/1.1 data on the hard disk of PC in
real time, and those data are displayed intelligibly on the PC
screen.
LE-620HS-E is a USB2.0 protocol analyzer which
connects with a PC, and analyzes "USB Protocol." This model supports HIGH/FULL/LOW Speed and continuously records USB2.0/1.1 data on the hard disk of PC in
real time, and those data are displayed intelligibly on the PC
screen.| New version (Ver. 3.2.0.0) released. | |
| For users using old version (Ver. 3.1.2.1 or before), download a new version from the support page. |
| See details on product | Specifications |
| Supports 480Mbps | Easy to use, and reasonable cost | ||
| 256MB memory | FPGA composition |
HIGH/FULL/LOW Speed Modes Automatic Identification
Without affecting the communication line carrying data between the analyzer and target devices, the LE-620HS-E internally records large amounts of data and simultaneously transfers it to a PC via USB. The LE-620HS-E automatically detects the speed of the target devices (480/12/1.5 Mbps), so a speed setting is unnecessary. And, if the device connects through a hub of differing speed, measurement can start by simply pressing the space key of the PC's keyboard.
PCs with a USB2.0 port which supports HIGH-speed are recommended.
If you use a USB port for FULL-speed, capturing up to 256MB is only guaranteed.
Continuously Record up to a Max,20Gbyte
LE-620HS-E continues to transfer USB data to the analysis PC via a USB port and records the log file of Max. 2Gbytes into the PC's hard disk drive. Also, the repeat mode allows to use up to 10 log files as the ring buffer and to continuously record the log up to 20Gbytes. Since you can scroll up the log displayed on the screen during measuring to find old log, it is effective in the analysis of the non-specific trouble which rarely happens.
| Log file size | Number of log files while in repeat mode | Maximum recording capacity |
|---|---|---|
| 1 to 2,048 Mbytes | 2 to 10 | 20 Gbytes |
Intelligible Display
Packets are intelligibly displayed in transaction unit during measurement. PING and the split transaction at high speed can be checked. This model can translate and clearly display not only the standard device request and descriptor but also each descriptor of Communication device class and HUB/HID/Audio/Communication class-specific device request; therefore, you can understand difficult USB protocol easily and intuitively.
| (1) | Displays plural packets in one line in one transaction unit | ||||||
| (2) | Displays SOF number (Start of Frame). High speed shows the micro frame as "(1/8)" - "(8/8)". Because low speed does not generate SOF packets, nothing appears in this column. | ||||||
| (3) | Displays Token Packet (Token type / address / end point). | ||||||
| (4) | Shows the first eight bytes only of a data packet. To display the rest of it, click the + mark. | ||||||
| (5) | Handshake packet. | ||||||
| (6) | Displays time stamp. (elapsed time) | ||||||
|
|||||||
| (7) | Records and displays the USB bus states. | ||||||
|
|||||||
|
|||||||
| (8) | Marks the user-defined transactions from 1 to 99. Marking makes it possible to jump the marked transactions. | ||||||
| (9) |
Full-speed device <-> Hi-speed device <-> USB stream scope <->USB HOST PC. Full-speed device is converted to Hi-speed device by Hi-speed HUB. |
||||||
| (10) | Highlights a transaction which you select with a mouse. (Press SHIFT + CTRL to select more than one transaction.) |
- Displays the content / meaning of device request.
- Displays the DATA packets in ASCII.
- Opens the device request window by clicking >> mark on the display.
The shape of tree shows the layerde stracture of a descriptor. - Blinks the corresponding data in the data packet by selecting the item of the device request window.
Device Request Window
- Button for opening and closing the tree.
- Button for copying the contents of the Device Request/Descriptor to the clip board.
- Button for displaying the previous/next Device Request.
- Button for pinning the Device Request on the screen.
- Button for adjusting the depth of the color.
Highly Accurata Time Stamp Function
The built-in hardware timer of the analyzer records the time stamps at the packet start and end at a resolution of 16.7 ns based on the log start point as a reference point*1. The time stamps are displayed in the elapse time column and packet position bar. If the cursor points the packet, the time stamps are displayed on the tool tip window as well.
PCs with a USB2.0 port which supports HIGH-speed are recommended.
If you use a USB port for FULL-speed, capturing up to 256MB is only guaranteed.
Real-time Filter
The real-time filter reduces the quantity of log file data and improves the efficiency of analysis. It is possible to specify not to capture continuous NAK response transaction such as IN-NAK and OUT-NAK. And can specify particular addresses and end points under AND condition in order to record only transactions which meet the condition, or to eliminate them from the targets of recording.
Powerful Sequential Trigger
| It is possible to specify up to 16 trigger conditions (e.g., trigger conditions of particular transfer data and external signal conditions) in combination with actions to be taken at the time the conditions are satisfied, and execute the actions in sequence. Furthermore, this feature enables logging control in synchronization with external signals and linking with other measuring instruments by turning an external trigger signal on detection of particular data, thus making significant improvement in the efficiency of program development. | [ Packet trigger setting example 1
] |
[ Error trigger setting example 2 ] |
[ External trigger setting example 3 ] |
Upgraded Off-Line Analysis Capability
Data can be easily found among the huge volume of recorded data by using the filter function. It incorporates a advanced search function, such as searching for a standard request, class-divided request and class command.
Development efficiency is boosted to a higher level by using color-coded customization features for packet types and mark/jump features.
[Filter Condition Setting screen]
|
|
[Search address/end point combination condition example]
|
|
| [Search Condition (searching for standard/class-devided request and class command)] | |
|
|
|
[Search Result]
 Highlight matched data with search condition. |
|
Statistical Infomation Function
It is possible to total and check the number of transactions, the number of transfer bytes, and the average transfer rate in the measurement log. The totaling range can be specified with the mouse or the mark feature. The results of totaling can be pasted to the table calculation software through the clipboard.
Target area
|
 |
Displaying/Hiding the Packets
You can display or hide the result of statistics for each packet from the pop-up menu, which appears by right-clicking on each item of the packets.
Copying data to the spreadsheet applications
By selecting the necessary range and copying it to the clipboard with the Ctrl and C keys, you can paste it to another application such as Excel.
Arranging data
Clicking the head of the table helps arrange data in ascending or descending order.| Initial screen | Ascending | Descending |
|---|---|---|
 |
 |
 |
Practical Use of Measurement Data
Copying and pasting the specified range of stored data enables you to save in the text format. If you send monitored data to a remote place, only monitored data can be saved in the text file. With analysis software, it is possible to analyze monitored data in detail from a PC at the remote place.| See the image of a text file saved |
Updating to Firmware
You can download the latest version of software from our website to take advantage of the latest functions and features| Download the latest version |